为什么不能将 LeakCanary 用于 release 包?
如何将 LeakCanary 应用于正式发布包?
官方明确表示 LeakCanary 只适用于开发包中的内存泄漏。参考
LeakCanary should only be used in debug builds, and should be disabled in release builds. We provide a special empty dependency for your release builds: leakcanary-android-no-op.
The full version of LeakCanary is bigger and should never ship in your release builds.
这也是为什么通常来讲,debug 包使用 leakcanary-android,release 包使用 leakcanary-android-no-op。
1
2
3
4
dependencies { debugImplementation 'com.squareup.leakcanary:leakcanary-android:1.6.3' releaseImplementation 'com.squareup.leakcanary:leakcanary-android-no-op:1.6.3' }
LeakCanary 在 release 包真的无用武之地吗,毕竟 release 包中也的的确确可能存在内存泄漏。
性能影响 为什么要在 release 包中关闭 LeakCanary 呢?答案是它会对应用性能产生影响。具体分析如下。关键点都在 RefWatcher 中
LeakCanary 检查内存泄漏包括四个阶段:
watch
gc
heap dump
analysis
logcat 中可以看到如下日志:
1
2
3
... 2019-02-09 10:47:55.287 3483-3932/com.example.leakcanary:leakcanary D/LeakCanary: * Durations: watch=5046ms, gc=149ms, heap dump=5121ms, analysis=1348ms ...
从上述数据来看,这四个阶段对性能的影响从大到小分别是:heap dump > watch > analysis > gc。不过实际情况并非如此。
watch 实际上 watch 阶段对性能的影响非常小。虽然从数据上看有 5s 之久,但这个其实是等待时间。等待过程中并不额外消耗 CPU 或 IO 资源。
watch 阶段指的是调用 RefWatcher.watch() 后到 RefWatcher.ensureGone() 实际被执行的耗时。
1 2 3 4 5 6 7 8 9 10 11 12 13 14 15 16 17 18 19 20 21 22 23 24 private void waitForIdle (final Retryable retryable, final int failedAttempts) { Looper.myQueue().addIdleHandler(new MessageQueue .IdleHandler() { @Override public boolean queueIdle () { postToBackgroundWithDelay(retryable, failedAttempts); return false ; } }); } private void postToBackgroundWithDelay (final Retryable retryable, final int failedAttempts) { long exponentialBackoffFactor = (long ) Math.min(Math.pow(2 , failedAttempts), maxBackoffFactor); long delayMillis = initialDelayMillis * exponentialBackoffFactor; backgroundHandler.postDelayed(new Runnable () { @Override public void run () { Retryable.Result result = retryable.run(); if (result == RETRY) { postWaitForIdle(retryable, failedAttempts + 1 ); } } }, delayMillis); } }
RefWatcher.ensureGone() 被封装成 Retryable 主线程空闲时才由 postToBackgroundWithDelay() 调用该 Retryable
Retryable 最终由名为 LeakCanary-Heap-Dump 的 HandlerThread 处理,延迟时间为 delayMillisinitialDelayMillis 为 5s
delayMillis 是基于 initialDelayMillis 和 failedAttempts (失败次数) 计算得到的。delayMillis 也为 5s
从上面的分析可知,watch 阶段对性能基本无影响。
gc 频繁 gc 会对应用性能产生影响。作为良好实践,我们也应该避免调用 System.gc() 或 Runtime.gc() 主动触发 gc。
1
2
3
4
5
6
7
8
9
10
11
12
13
14
15
16
17
18
19
20
21
22
23
24
25
26
public interface GcTrigger { GcTrigger DEFAULT = new GcTrigger () { @Override public void runGc () { Runtime.getRuntime().gc(); enqueueReferences(); System.runFinalization(); } private void enqueueReferences () { try { Thread.sleep(100 ); } catch (InterruptedException e) { throw new AssertionError (); } } }; void runGc () ; }
gc 阶段指的是 GcTrigger() 的耗时。实际上 ART 虚拟机中 gc 带来的开销已大大减少,日志中 gc=149ms,其中有 100ms 的开销是由于线程主动 sleep() 带来的。
heap dump heap dump 对 app 的性能影响非常大。AndroidHeapDumper 实现了 HeapDumper 接口,它调用 Debug.dumpHprofData() 方法进行 heap dump。
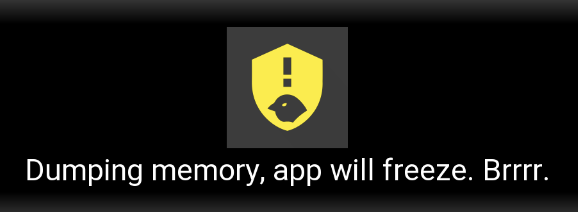
heap dump 是非常重的磁盘 IO 操作,虽然发生在 LeakCanary-Heap-Dump 线程,仍然可能让 UI 卡顿,以至于 LeakCanary 会弹出如下提示:
1 2 3 4 5 6 7 8 9 10 11 12 13 14 15 16 17 18 19 20 21 22 23 24 25 26 27 28 29 30 31 32 33 34 35 36 37 @Override @Nullable public File dumpHeap () { File heapDumpFile = leakDirectoryProvider.newHeapDumpFile(); if (heapDumpFile == RETRY_LATER) { return RETRY_LATER; } FutureResult<Toast> waitingForToast = new FutureResult <>(); showToast(waitingForToast); if (!waitingForToast.wait(5 , SECONDS)) { CanaryLog.d("Did not dump heap, too much time waiting for Toast." ); return RETRY_LATER; } Notification.Builder builder = new Notification .Builder(context) .setContentTitle(context.getString(R.string.leak_canary_notification_dumping)); Notification notification = LeakCanaryInternals.buildNotification(context, builder); NotificationManager notificationManager = (NotificationManager) context.getSystemService(Context.NOTIFICATION_SERVICE); int notificationId = (int ) SystemClock.uptimeMillis(); notificationManager.notify(notificationId, notification); Toast toast = waitingForToast.get(); try { Debug.dumpHprofData(heapDumpFile.getAbsolutePath()); cancelToast(toast); notificationManager.cancel(notificationId); return heapDumpFile; } catch (Exception e) { CanaryLog.d(e, "Could not dump heap" ); return RETRY_LATER; } }
analysis 与 heap dump 这个 IO 密集型操作不同,analysis 是个 CPU 密集型操作。
1
2
3
4
5
6
7
8
9
10
11
12
13
14
15
16
17
18
19
20
21
Retryable.Result ensureGone (final KeyedWeakReference reference, final long watchStartNanoTime) { ... if (!gone(reference)) { long startDumpHeap = System.nanoTime(); long gcDurationMs = NANOSECONDS.toMillis(startDumpHeap - gcStartNanoTime); File heapDumpFile = heapDumper.dumpHeap(); ... long heapDumpDurationMs = NANOSECONDS.toMillis(System.nanoTime() - startDumpHeap); HeapDump heapDump = heapDumpBuilder.heapDumpFile(heapDumpFile).referenceKey(reference.key) .referenceName(reference.name) .watchDurationMs(watchDurationMs) .gcDurationMs(gcDurationMs) .heapDumpDurationMs(heapDumpDurationMs) .build(); heapdumpListener.analyze(heapDump); } return DONE; }
RefWatcher 将 heap 文件封装成 HeapDump 对象,并交由 HeapDump.Listener 进行分析。ServiceHeapDumpListener 是缺省的 HeapDump.Listener。
1
2
3
4
5
6
7
8
9
10
11
12
13
14
15
16
17
18
19
20
21
22
23
24
25
26
27
28
29
30
31
32
33
34
public final class ServiceHeapDumpListener implements HeapDump .Listener { private final Context context; private final Class<? extends AbstractAnalysisResultService > listenerServiceClass; public ServiceHeapDumpListener (@NonNull final Context context, @NonNull final Class<? extends AbstractAnalysisResultService> listenerServiceClass) { this .listenerServiceClass = checkNotNull(listenerServiceClass, "listenerServiceClass" ); this .context = checkNotNull(context, "context" ).getApplicationContext(); } @Override public void analyze (@NonNull HeapDump heapDump) { checkNotNull(heapDump, "heapDump" ); HeapAnalyzerService.runAnalysis(context, heapDump, listenerServiceClass); } } `ServiceHeapDumpListener` 又将真正的 analyze 工作交给 `HeapAnalyzerService` 进行处理。 为了避免拖慢应用的速度或引起 OOM,`HeapAnalyzerService` 运行在 `:leakcanary` 进程。 ```xml <application> <service android:name=".internal.HeapAnalyzerService" android:process=":leakcanary" android:enabled="false" /> <service android:name=".DisplayLeakService" android:process=":leakcanary" android:enabled="false" /> </application>
核心代码代码非常简单明了:
1
2
3
4
5
6
7
8
9
10
11
12
13
14
15
@Override protected void onHandleIntentInForeground (@Nullable Intent intent) { if (intent == null ) { CanaryLog.d("HeapAnalyzerService received a null intent, ignoring." ); return ; } String listenerClassName = intent.getStringExtra(LISTENER_CLASS_EXTRA); HeapDump heapDump = (HeapDump) intent.getSerializableExtra(HEAPDUMP_EXTRA); HeapAnalyzer heapAnalyzer = new HeapAnalyzer (heapDump.excludedRefs, this , heapDump.reachabilityInspectorClasses); AnalysisResult result = heapAnalyzer.checkForLeak(heapDump.heapDumpFile, heapDump.referenceKey, heapDump.computeRetainedHeapSize); AbstractAnalysisResultService.sendResultToListener(this , listenerClassName, heapDump, result); }
解决方案 经过上面的分析可知,
watch - 对应用性能几乎无影响
gc - 对应用性能有少量影响,不应频繁主动触发 gc
heap dump - 对应用性能有影响,可能引起卡顿
analysis - 对应用性能有影响,特别耗 CPU 和 内存
解决方案如下:
方案一: 后台 analysis
不要主动 gc,而是等待系统 gc 事件
选择合适的 heap dump 时机
不要在客户端进行 analysis,而是上传 heap 至后台进行 analysis
方案二: 避免 analysis
watch 是为了检查是否有 leak,而 gc & heap dump & analysis 是为了找到最短强引用路径。前一步是为了发现问题,必须的步骤。后一步是为了解决问题,可选的步骤。
总结 watch 放在 release 包中是没有问题的。